Skip to content
Solutions

Cube for Stadiums

Pre-match football intelligence for the big screen – fresh insights before every fixture.
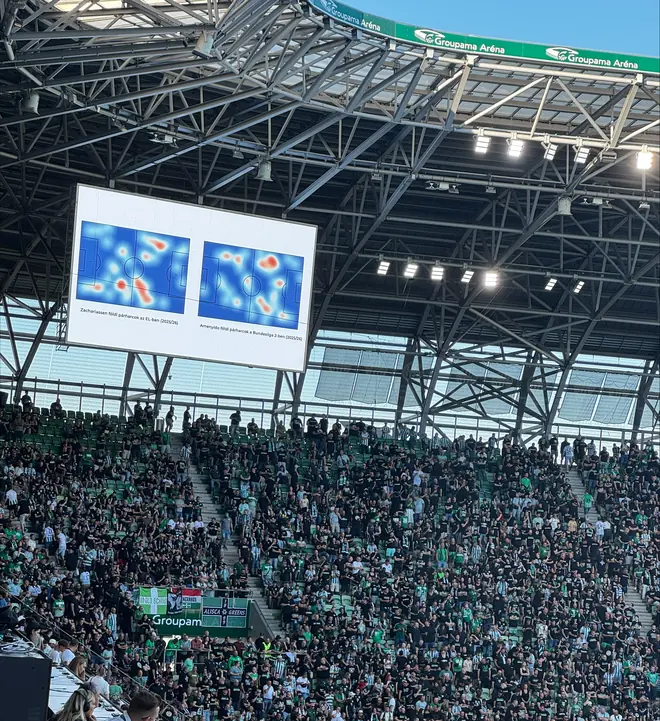
A Cube analysis on the big screen at the Groupama Aréna before kick-off, with two player heatmaps shown to a full stand.

Bring Football Intelligence to the Fans

Make Every Match More Engaging

Turn the time before kick-off into part of the matchday experience. Bring meaningful insights about the home team, away team and players to the stadium screen—giving fans something new to discover before the game even begins.
Ferencvárosi TC

NB I · 2026/2027

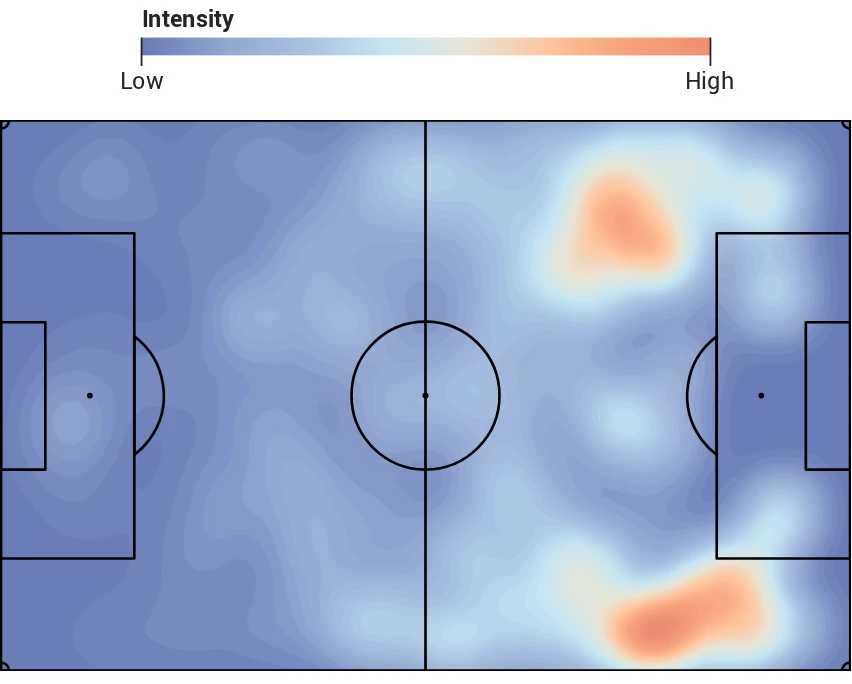
Expected-threat heatmap over a pitch diagram; warmer areas mark where more threat was created.
Ferencvárosi TC xT heatmap (NB I – 2026/2027)
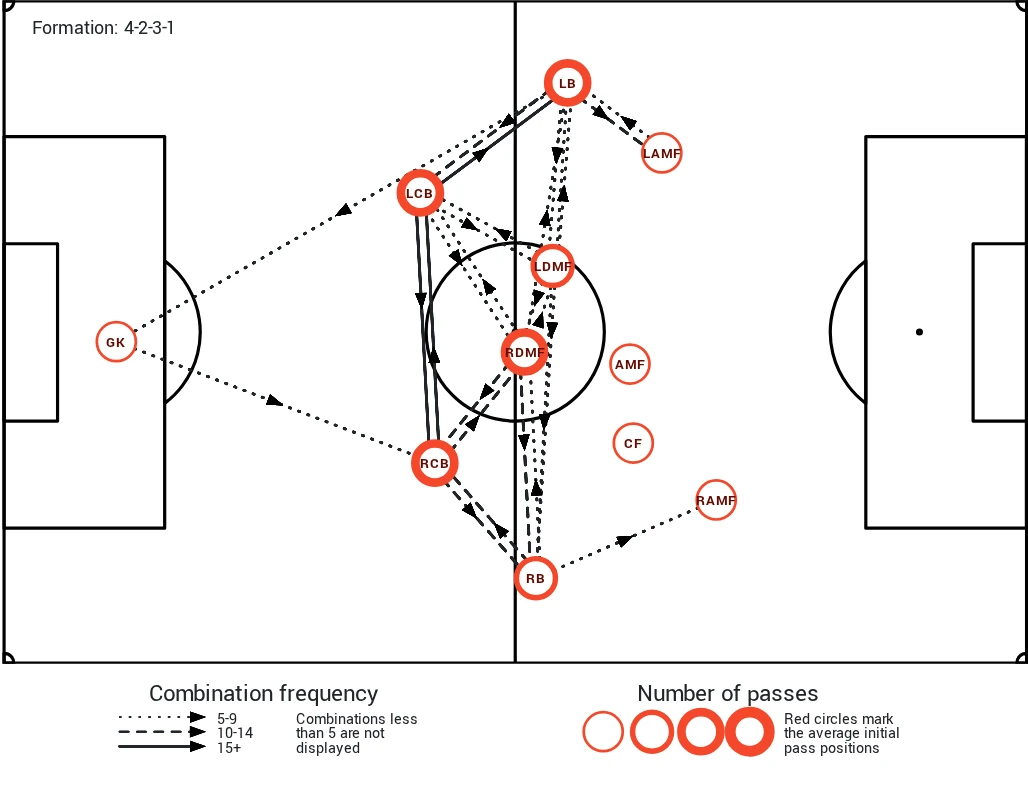
Pass network over a pitch diagram; circles mark each position's average passing origin and arrows the most frequent combinations.
Ferencvárosi TC pass network (NB I – 2026/2027)

Pre-Match Insights

Give Fans More Reasons to Look Up

Transform complex football data into engaging, easy-to-understand insights. Highlight key players, team strengths, recent form and fascinating statistics that capture attention and get fans talking before kick-off.
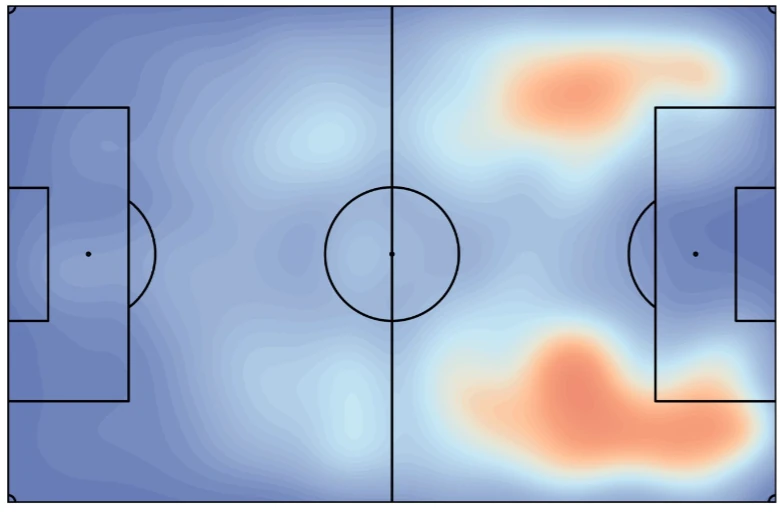
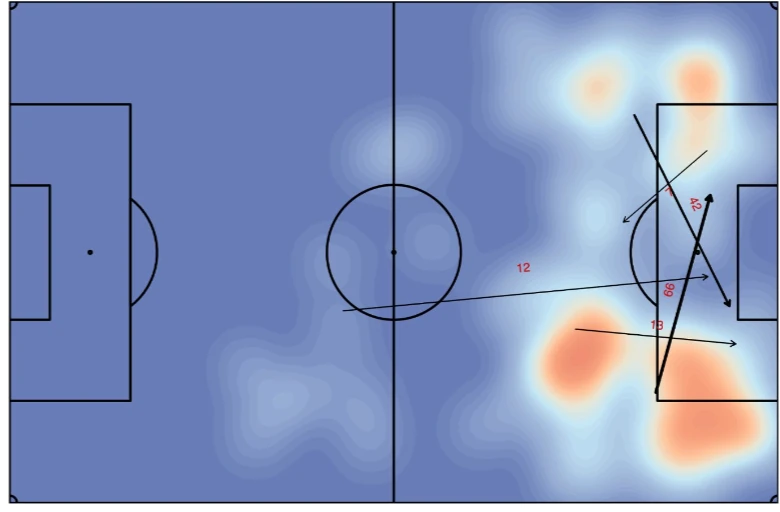
The opponent is more dangerous down the right

IntensityLowHigh
Expected-danger heatmap over a pitch diagram; warmer areas mark where more danger was created.
Expected-danger heatmap
IntensityLowHigh
Pitch diagram of typical key passes, drawn as arrows with the number of passes on each.
Typical key passes

Recurring Matchday Content

A New Insight Before Every Game

Keep your pre-match experience fresh with recurring data-driven features. Automatically bring relevant insights to the big screen for every fixture, creating a consistent format that fans can come to expect and look forward to.

Possession
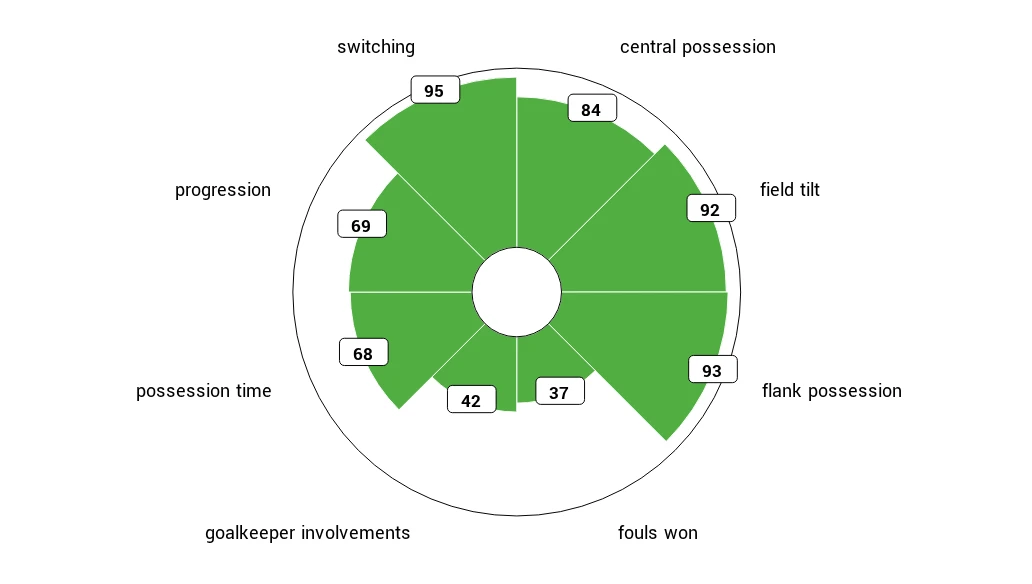
  • Exceptional switching
  • Exceptional flank possession
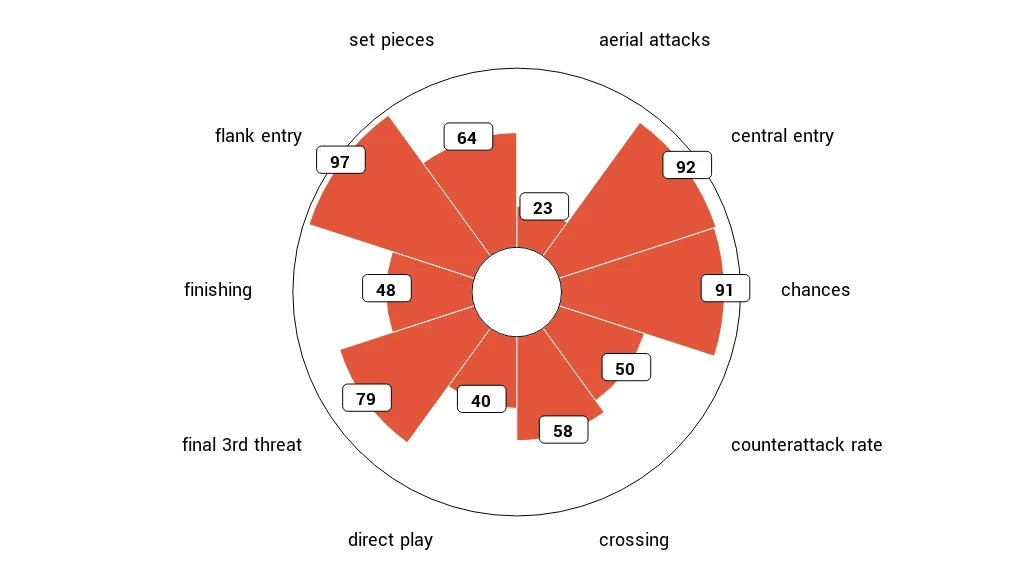
Radar chart of possession metrics; each segment is one metric scored from 0 to 100, and a longer segment is a stronger score.

Attacking

  • Exceptional flank entry
  • Exceptional central entry
Radar chart of chance-creation and finishing metrics; each segment is one metric scored from 0 to 100, and a longer segment is a stronger score.

Tailor-Made Stadium Reports

Built for Your Club. Designed for Your Fans.

Create custom reports and visualisations around the stories that matter most to your audience. Adapt the content to your club, your matchday experience and your stadium screens—turning football data into a visual part of the show.
Custom match report

UEFA Europa League qualifying

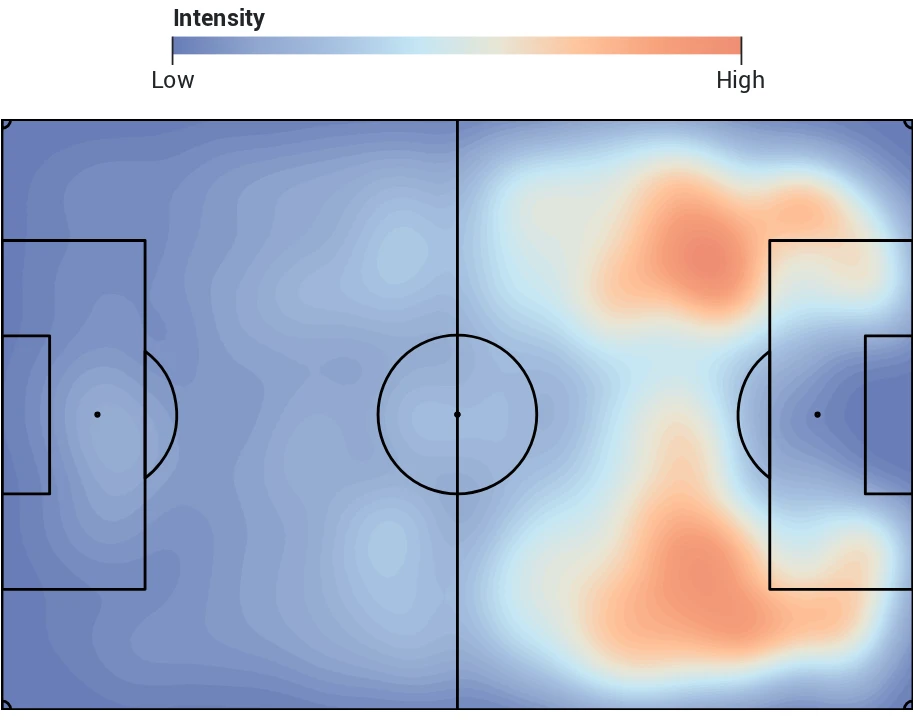
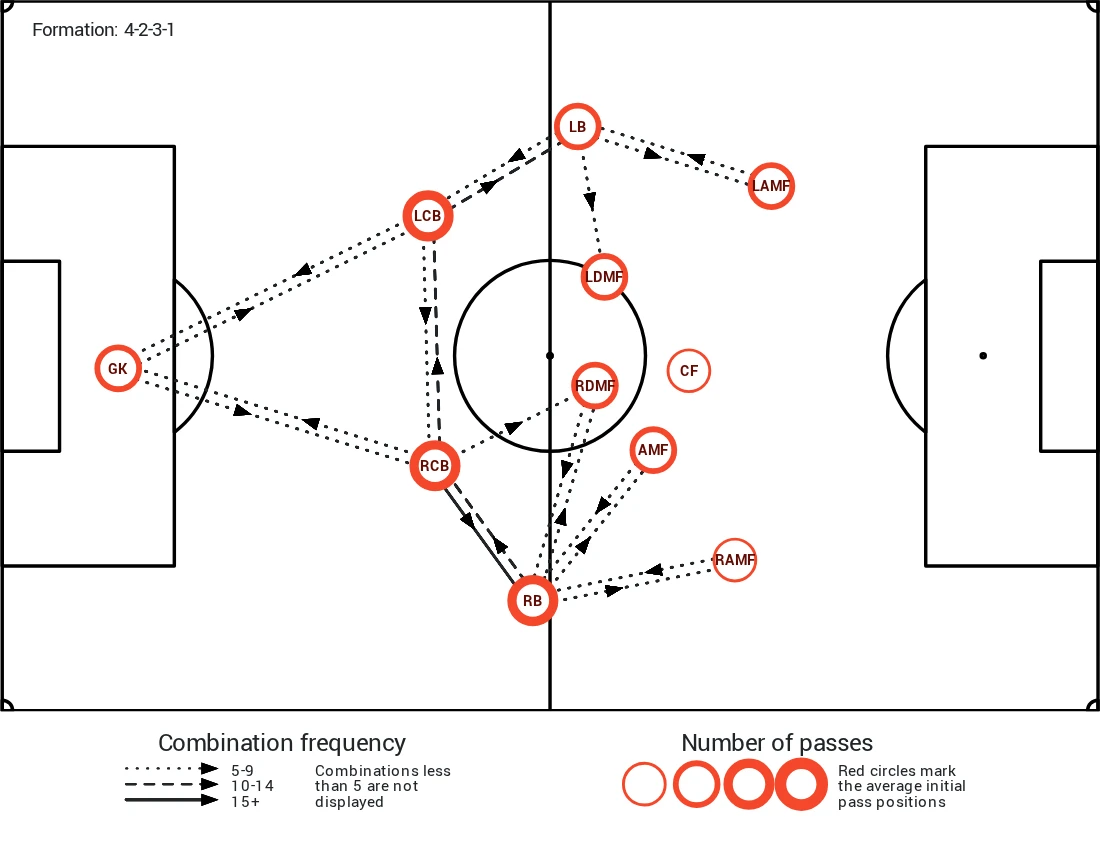
The opposition have played a distinctly possession-oriented style this season. Their most common formation is the 4-2-3-1, with one of the two central midfielders regularly dropping deep. Their build-up play is significantly more focused on the right-hand side, with the number 10 frequently drifting into the right half-space.

Expected-threat heatmap over a pitch diagram; warmer areas mark where more threat was created.
xT heatmap
Pass network over a pitch diagram; circles mark each position's average passing origin and arrows the most frequent combinations.
Pass network

See what Cube can do for your matchday