
Solutions
Cube for Fans & Bloggers
Professional-grade football visuals and insights, built for creators working without a research team.
Shareable Visualisations
Made for Your Feed
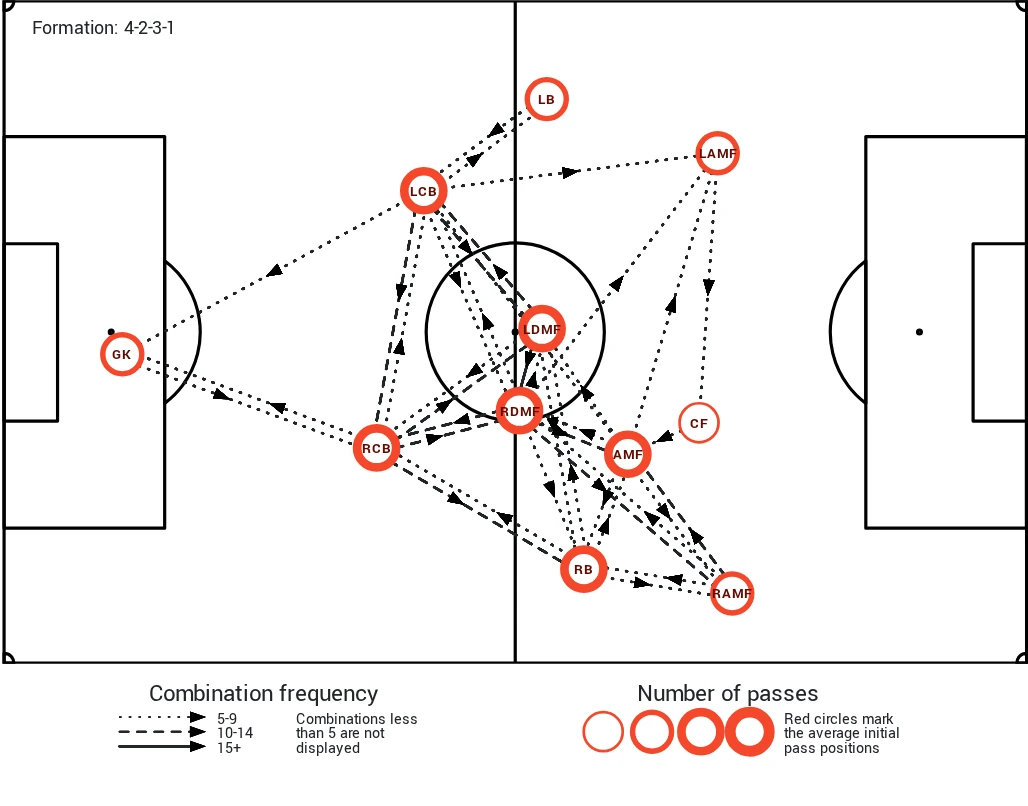
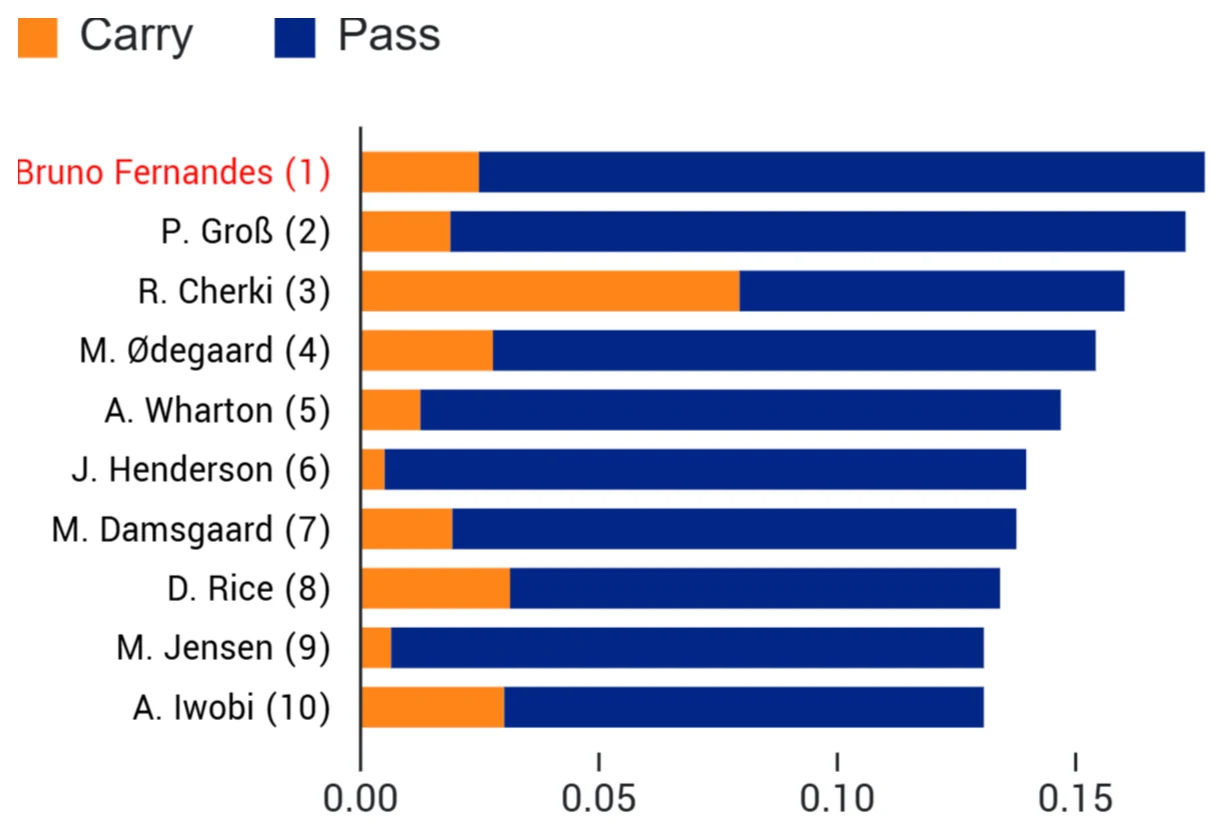
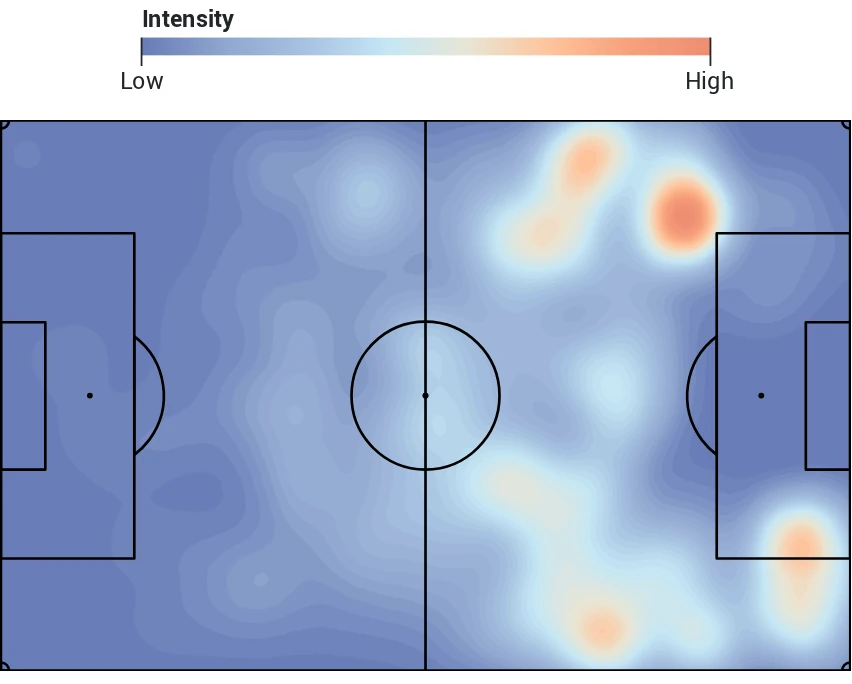
Turn any stat into a clean, publish-ready graphic. Our visualisations are sized for social media, no design software required.
Custom Content Angles
Find Your Story
Build the exact chart or comparison your next post needs, from a single stat to a full season breakdown.
Built for Creators
No Team Required
Whether you run a blog, a newsletter, or a growing channel, power your content with professional-grade visuals and automated insights. No research team required.