Skip to content
Solutions

Cube for Media

Data-driven tools for football journalism and broadcast -- from advanced statistics to ready-to-publish visualisations.
Advanced Statistics

Go Beyond Traditional Numbers

Access advanced football metrics that provide deeper insights into player and team performance.
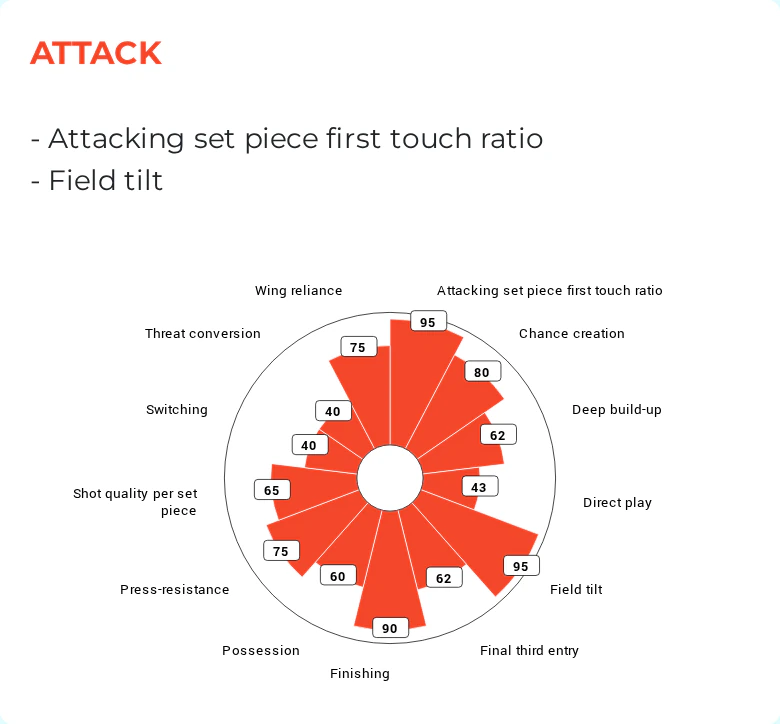
  • Percentile radar for a team's attacking style — chance creation, field tilt, possession, finishing and press-resistance, each ranked against the league.
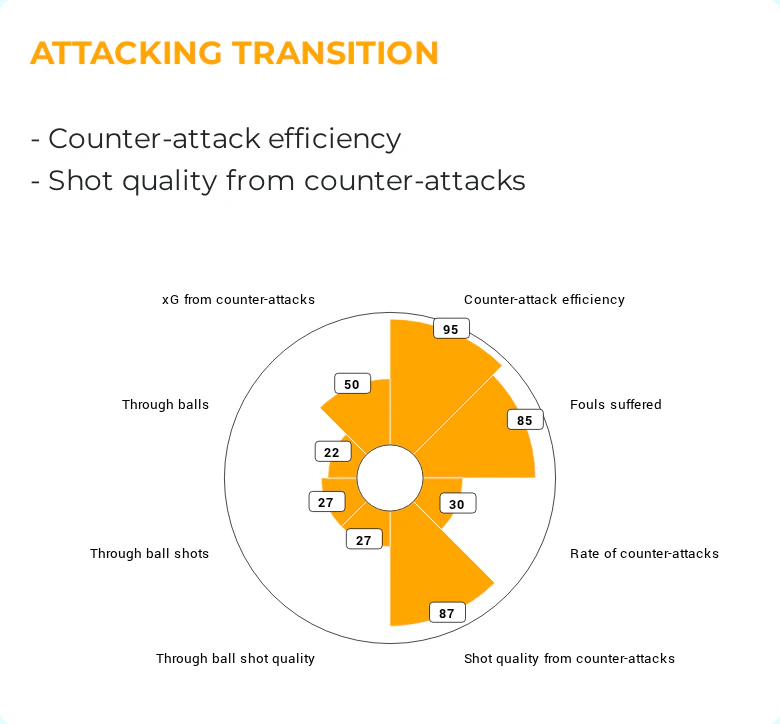
  • Percentile radar for attacking transitions — counter-attack efficiency and rate, shot quality from counter-attacks, and through balls.
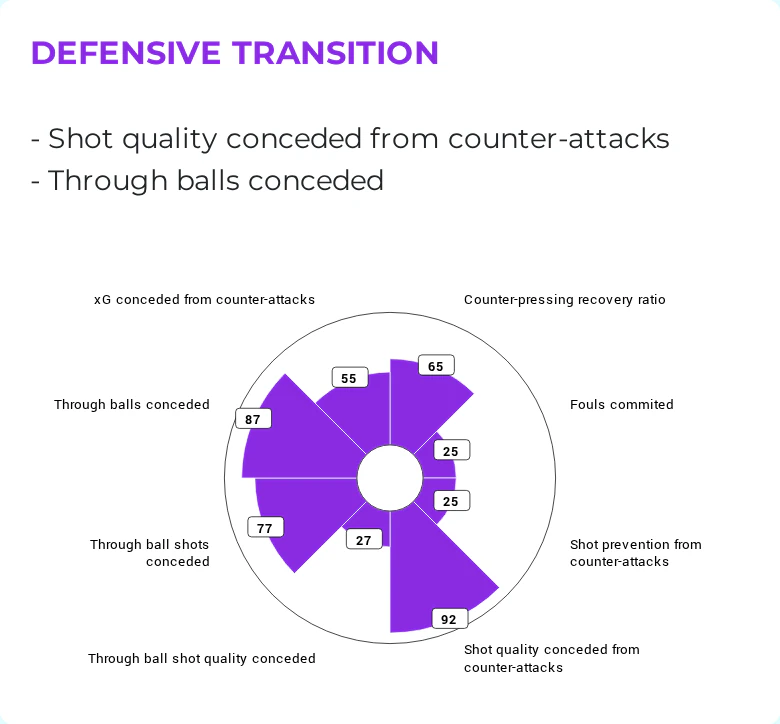
  • Percentile radar for defensive transitions — shot quality and xG conceded from counter-attacks, through balls conceded, and counter-pressing recovery.
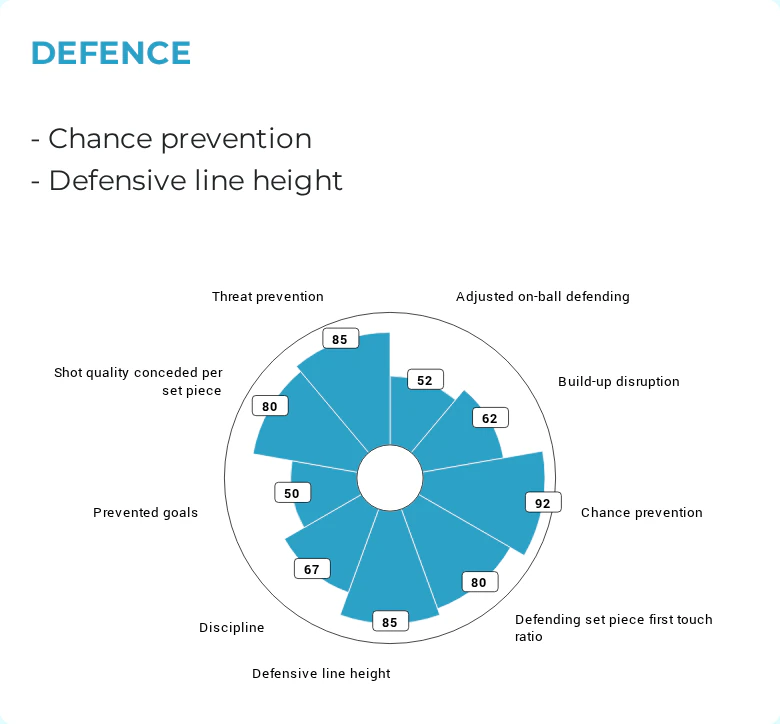
  • Percentile radar for defending — chance prevention, defensive line height, discipline, build-up disruption and prevented goals.
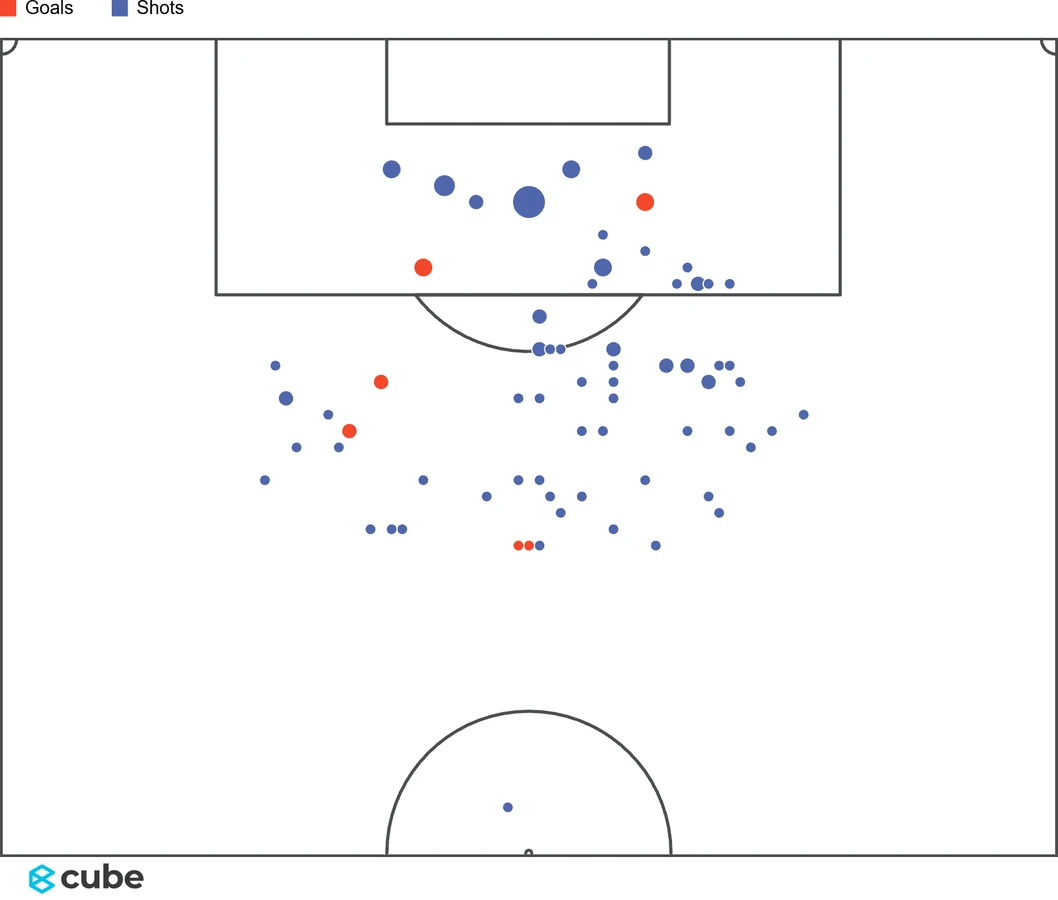
A shot map of a full season, with every shot and goal placed on the pitch and sized by how often it was taken.

Advanced Visualisations

Turn Data into Stories

Present complex football data through intuitive and engaging visualisations that help audiences understand the game in new ways.

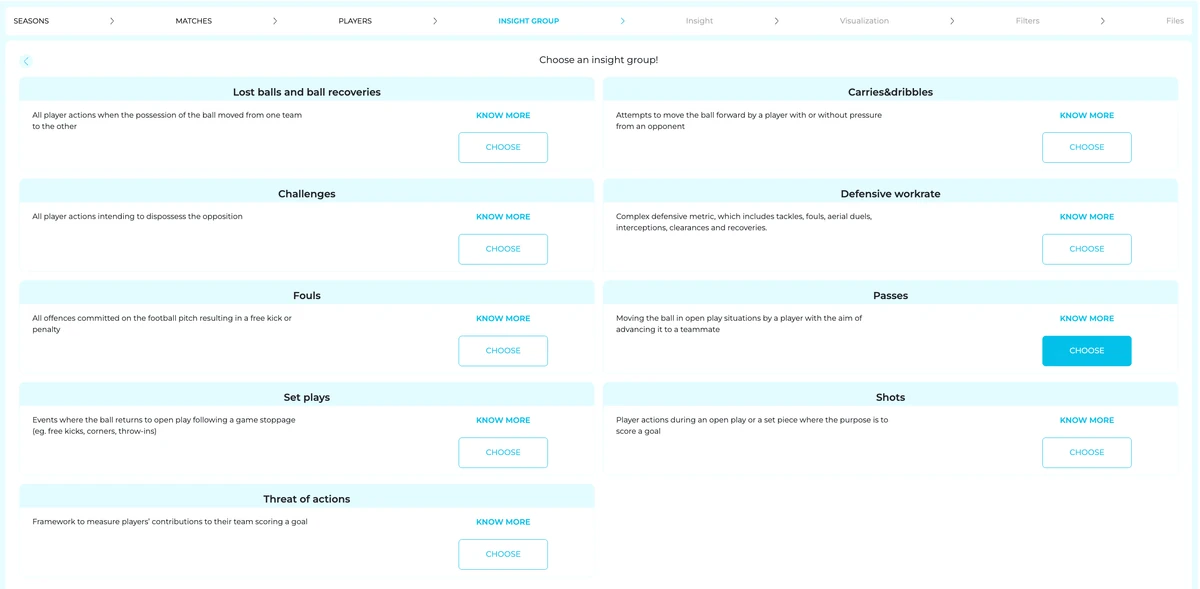
Cube’s analysis wizard, at the step where you choose an insight group: passes, shots, challenges, set plays, fouls, carries and dribbles, defensive workrate or threat of actions.

Custom Analyses

Ask Better Questions

Create bespoke analyses tailored to specific stories, topics or editorial projects.
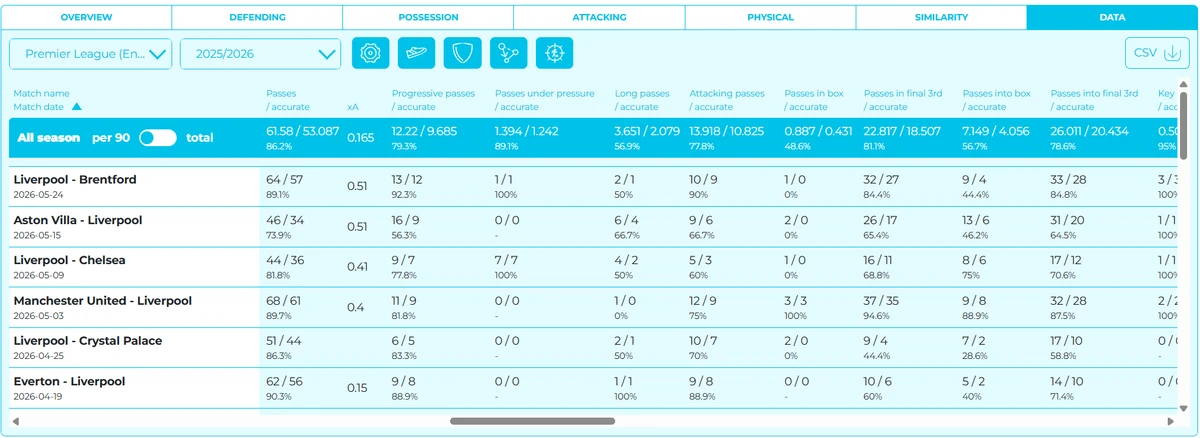
Cube’s data tab: per-match passing and possession figures for a full season, with a CSV export.

Trend Analysis

Spot Trends Before They Become Headlines

Identify emerging tactical patterns, player developments and league-wide trends through data-driven analysis.

For more options, see our custom services:

Custom Services

See what Cube can do for your newsroom