Skip to content
Solutions

Cube for Agencies

Data-driven tools for player representation -- from performance monitoring to negotiation-ready reports.
Custom Reports for Negotiations

Bring Evidence to the Negotiation Table

Support transfer discussions, contract negotiations and player presentations with professional reports built on objective performance data.
Player report

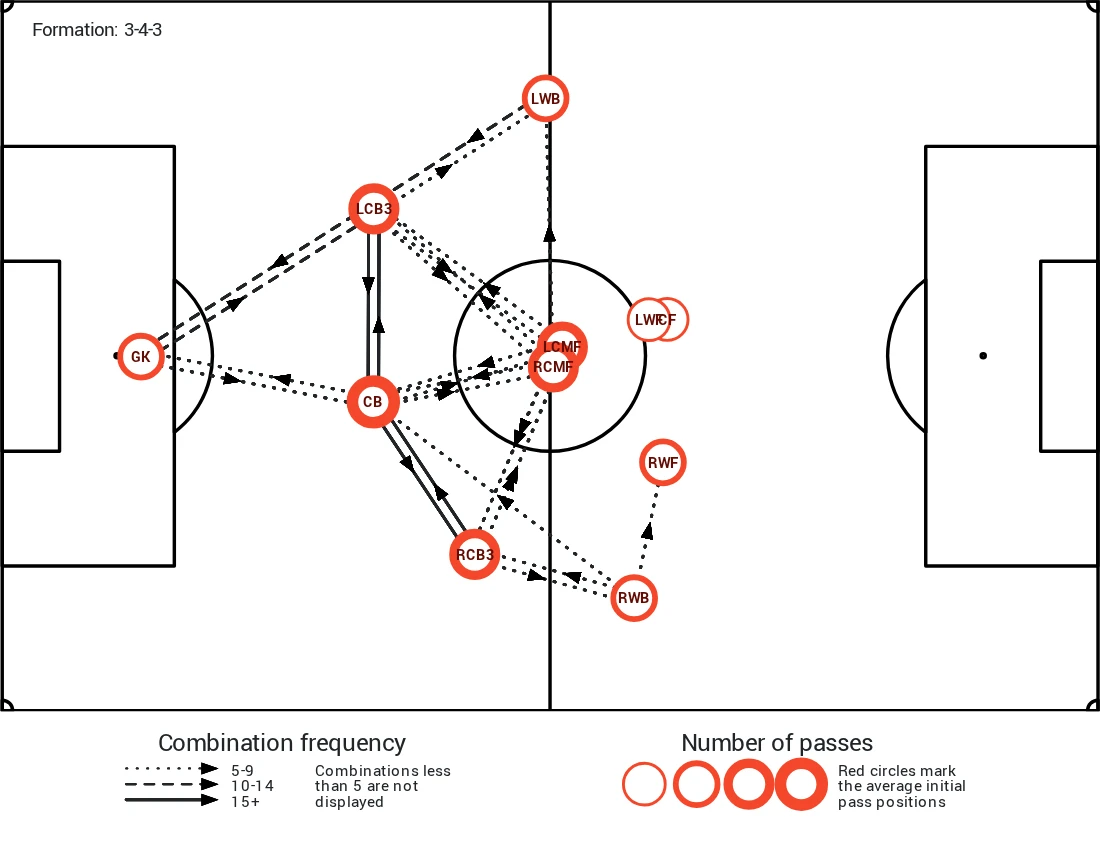
Pass network over a pitch diagram; circles mark each position's average passing origin and arrows the most frequent combinations.
Pass network
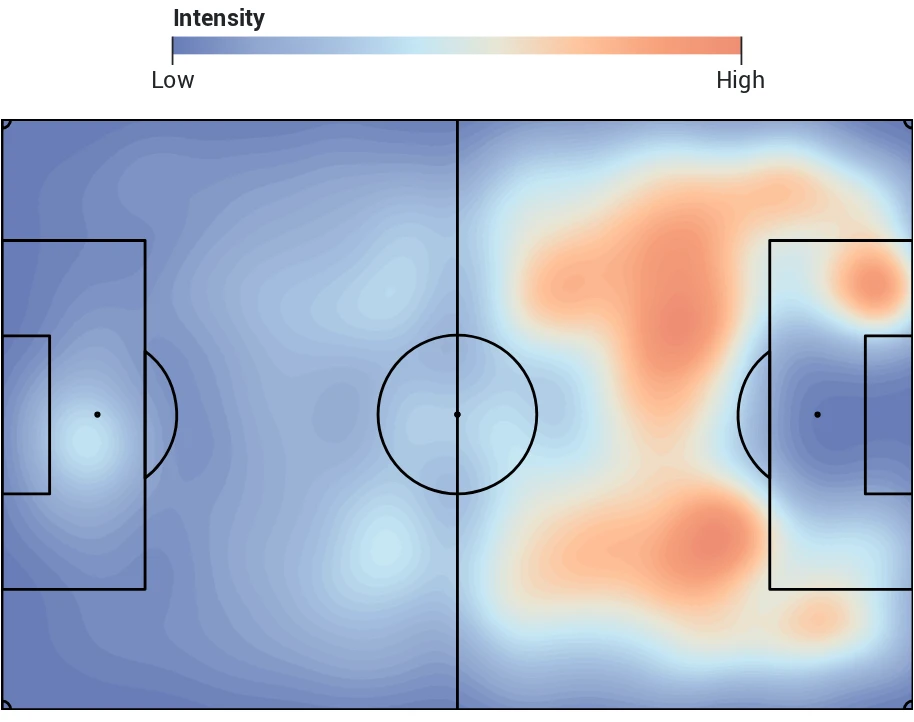
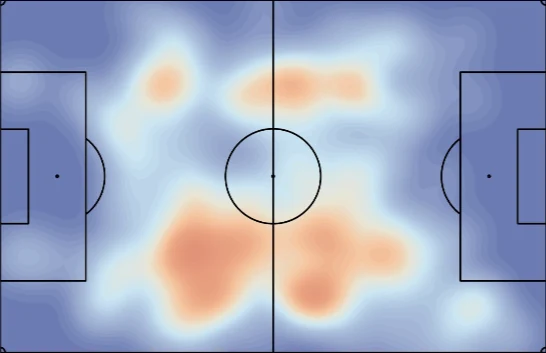
Heatmap over a pitch diagram showing where ground challenges were contested; warmer areas mark more duels.
Ground challenges
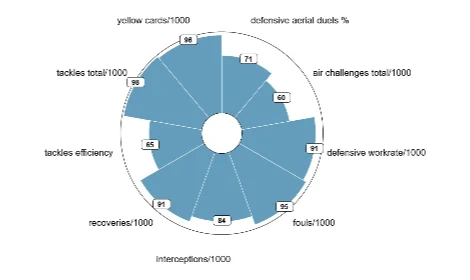
Radar chart of defending metrics; each segment is one metric scored from 0 to 100, and a longer segment is a stronger score.
Defending characteristics
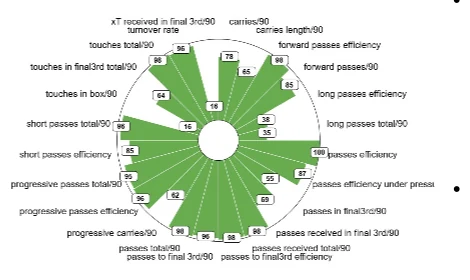
Radar chart of possession metrics; each segment is one metric scored from 0 to 100, and a longer segment is a stronger score.
Possession characteristics
  • A very ball-secure player who passed with 91% efficiency under pressure and ranks among the players with the fewest possession losses (top 5%).
  • Only one player attempted more tackles, yet he still maintains a top-35% tackle efficiency.
  • In aerial duels, he is well above average in both volume and efficiency.
  • Covers a lot of ground and puts in a significant defensive shift — ranks in the top 10% in defensive actions (38.12 defensive actions per game).

Career Advisory

What Should Be the Next Step?

Turn your player's data into a career roadmap: which league, which club, and which role offers the clearest path to growth.
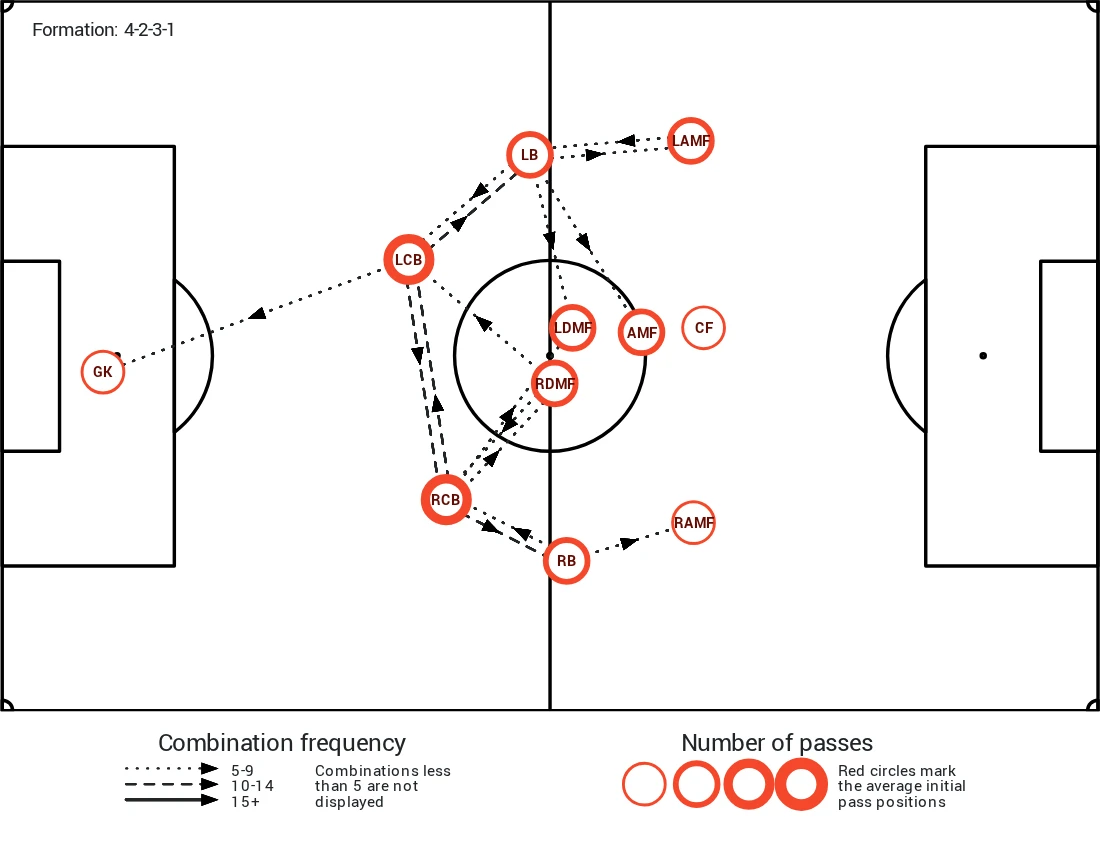
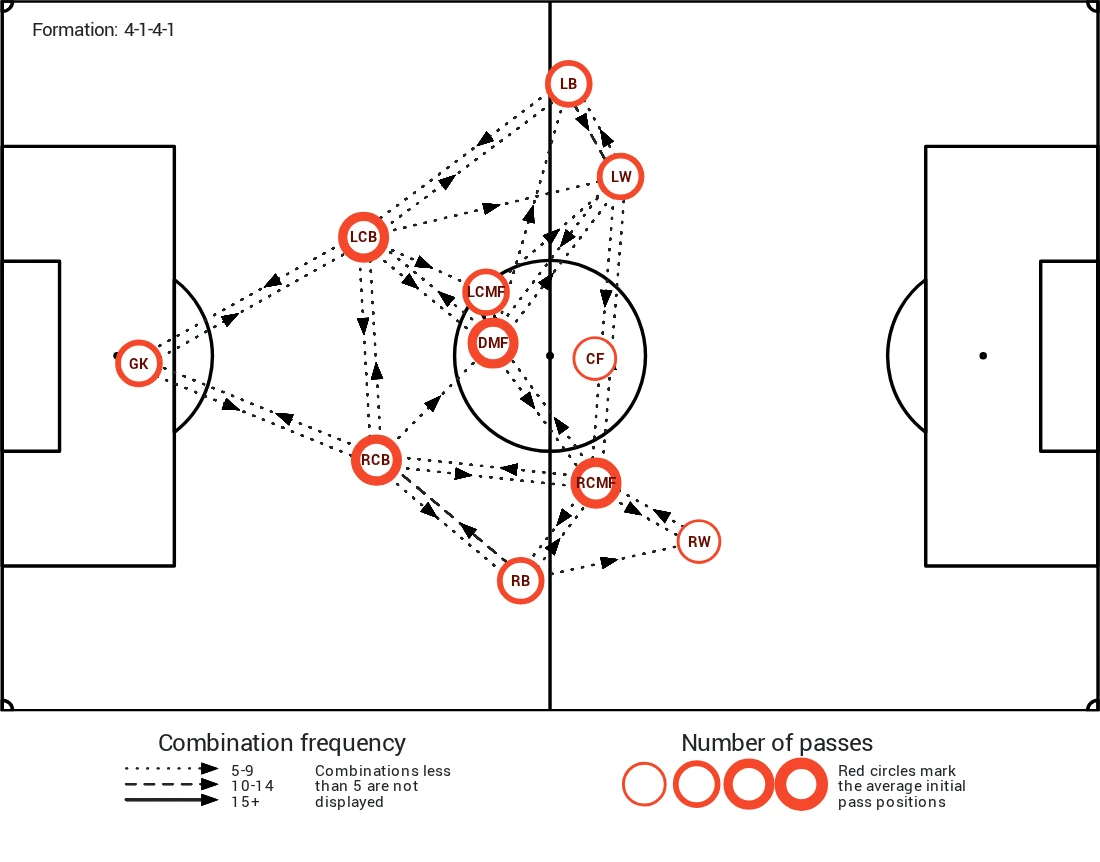
The two clubs share similar possession structures

Pass network over a pitch diagram; circles mark each position's average passing origin and arrows the most frequent combinations.
Pass network
Pass network over a pitch diagram; circles mark each position's average passing origin and arrows the most frequent combinations.
Pass network
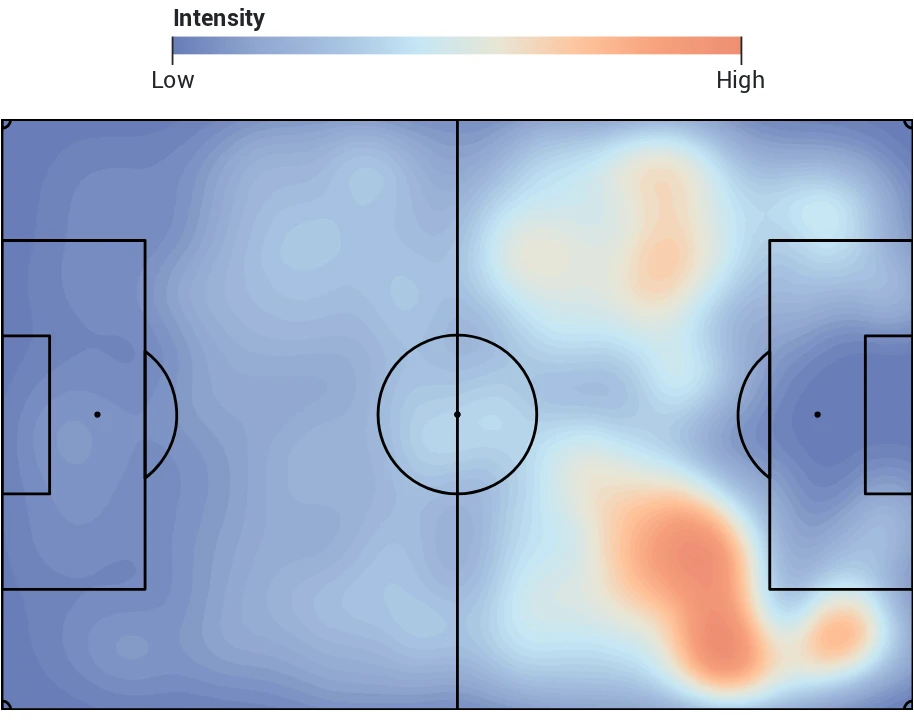
Expected-threat heatmap over a pitch diagram; warmer areas mark where more threat was created.
xT heatmap
Expected-threat heatmap over a pitch diagram; warmer areas mark where more threat was created.
xT heatmap
  • Both teams use a 4-2-3-1 structure with a double pivot in front of the defence.
  • Both teams are comfortable keeping possession and progressing the ball through central areas.
  • This is highly relevant for Jack, as he can operate as a right-sided 6/8 and play an important role in maintaining possession.
  • The club's pass network and xT map suggest that Jack could naturally support central progression and add quality in the right half-space.
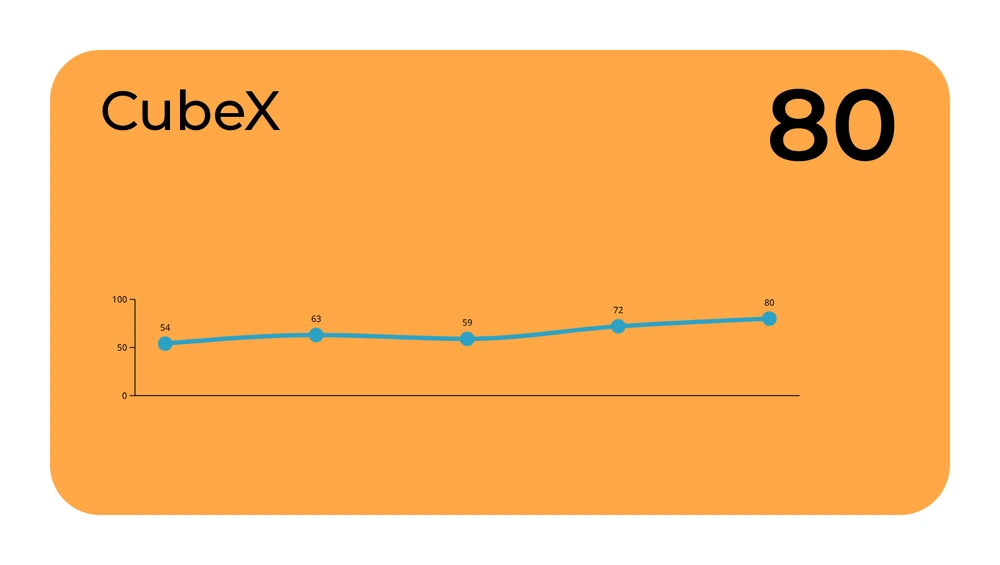
A player’s CubeX rating of 80, with the trend line of that rating across the season.

Player Performance Monitoring

Track Development Continuously

Monitor player performance throughout the season and identify key trends before they become visible to the wider market.

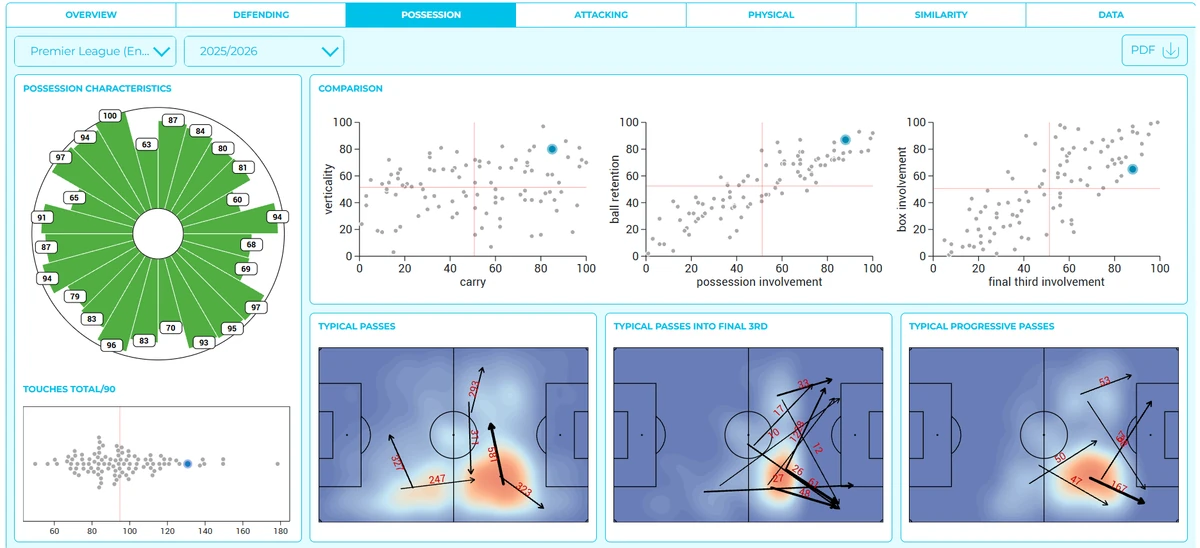
Cube’s player comparison view: a possession radar, scatter plots placing the player against the rest of the league, and maps of their typical passes.

Player Comparison

Compare with Confidence

Evaluate players against competitors, teammates or transfer targets through a consistent and objective analytical framework.

For more options, see our custom services:

Custom Services

See what Cube can do for your agency